
Case Studies
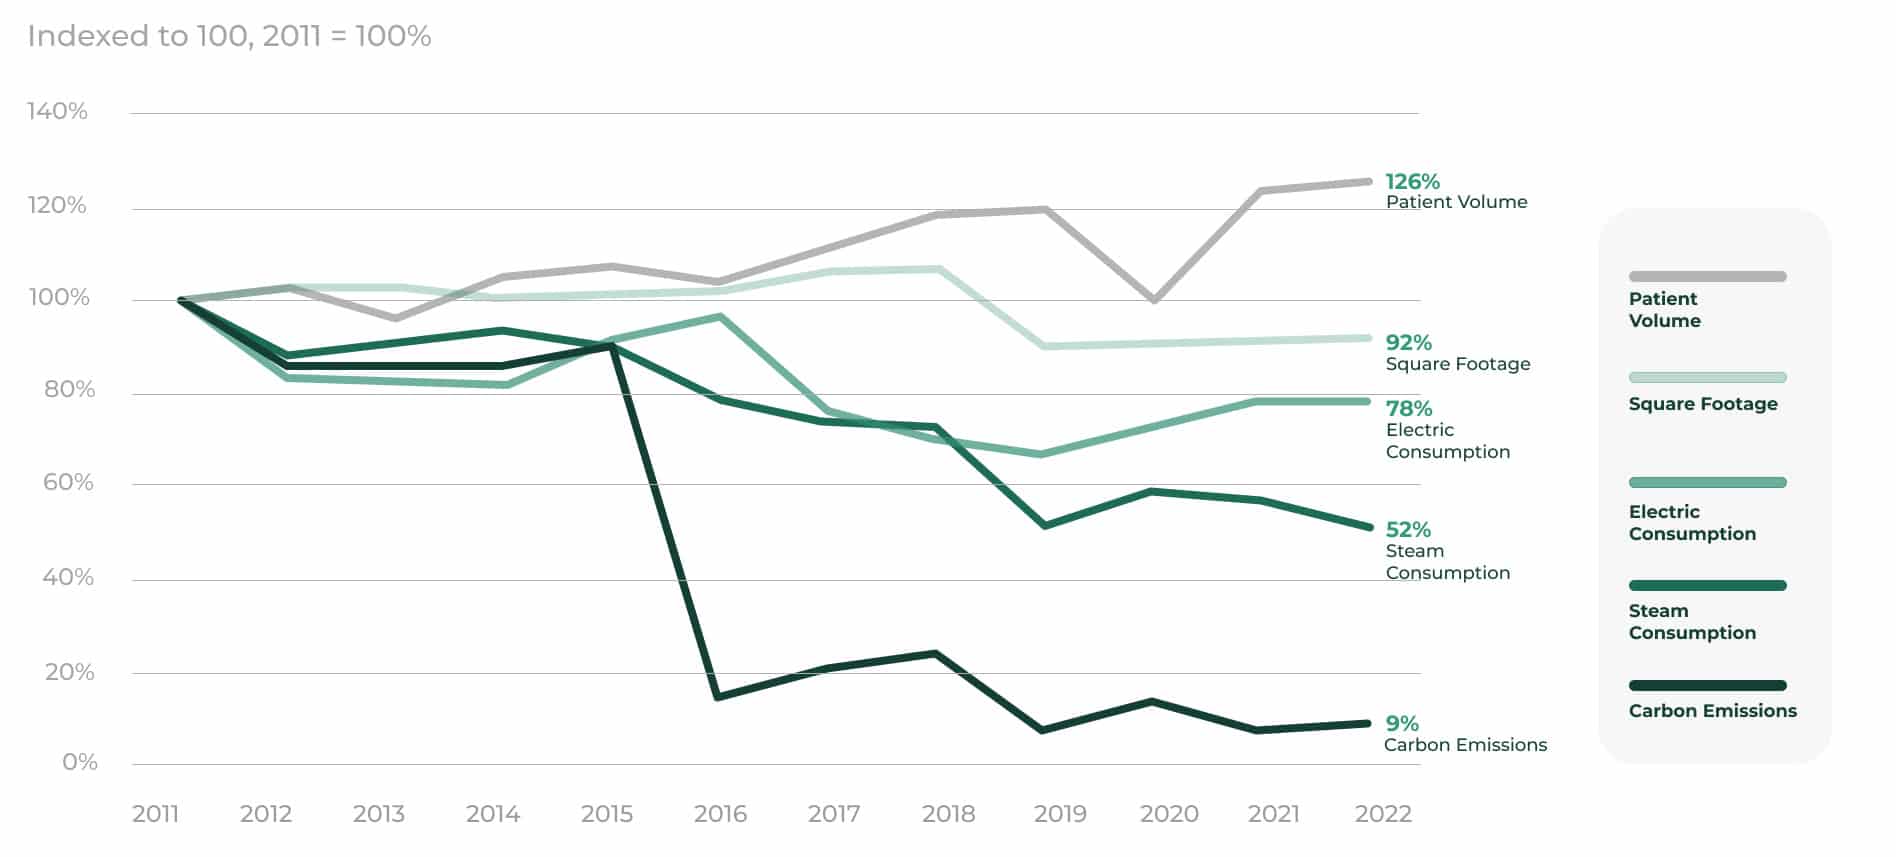
Case Study: Boston Medical Center Reduction in Consumption and Emissions as Patient Volumes Rise
2010-2011
In 2010-2011 BMC was on the brink of receivership with multiple years of declining patient volumes. The senior leadership launched an ambitious plan focused on improving the quality of care coupled with the redesign of its campus to shed waste, reduce overhead costs and reinvest the resulting savings in BMC's mission. The results are a transformed organization with a renewed state-of-the-art campus and a renewed commitment to BMC's founding mission of caring for the region's underserved communities. The resulting operating savings had a 6 year simple return on investment without even factoring the increase in patient volumes and revenues.
2018
Square Footage
Consolidated campus into smaller more efficient footprint saving $25 million of annual operating costs and reducing our carbon emissions.
2011-Present
Electric Consumption
Extensive deep energy efficiency retrofits, reduction of square footage in 2018. 2021-2022 growth in patient volumes are resulting in increased use of energy per SF.
2015-2016
Steam Consumption
Installed cogeneration plant replacing steam from district steam supplier with waste heat as a byproduct of generating electricity on site with the new cogeneration plant.
2016-2019
Carbon Emissions
Deep energy efficiency retrofits, NC solar VPPA, new cogen plant in 2016-2017, reduction of square footage in 2018-2019.

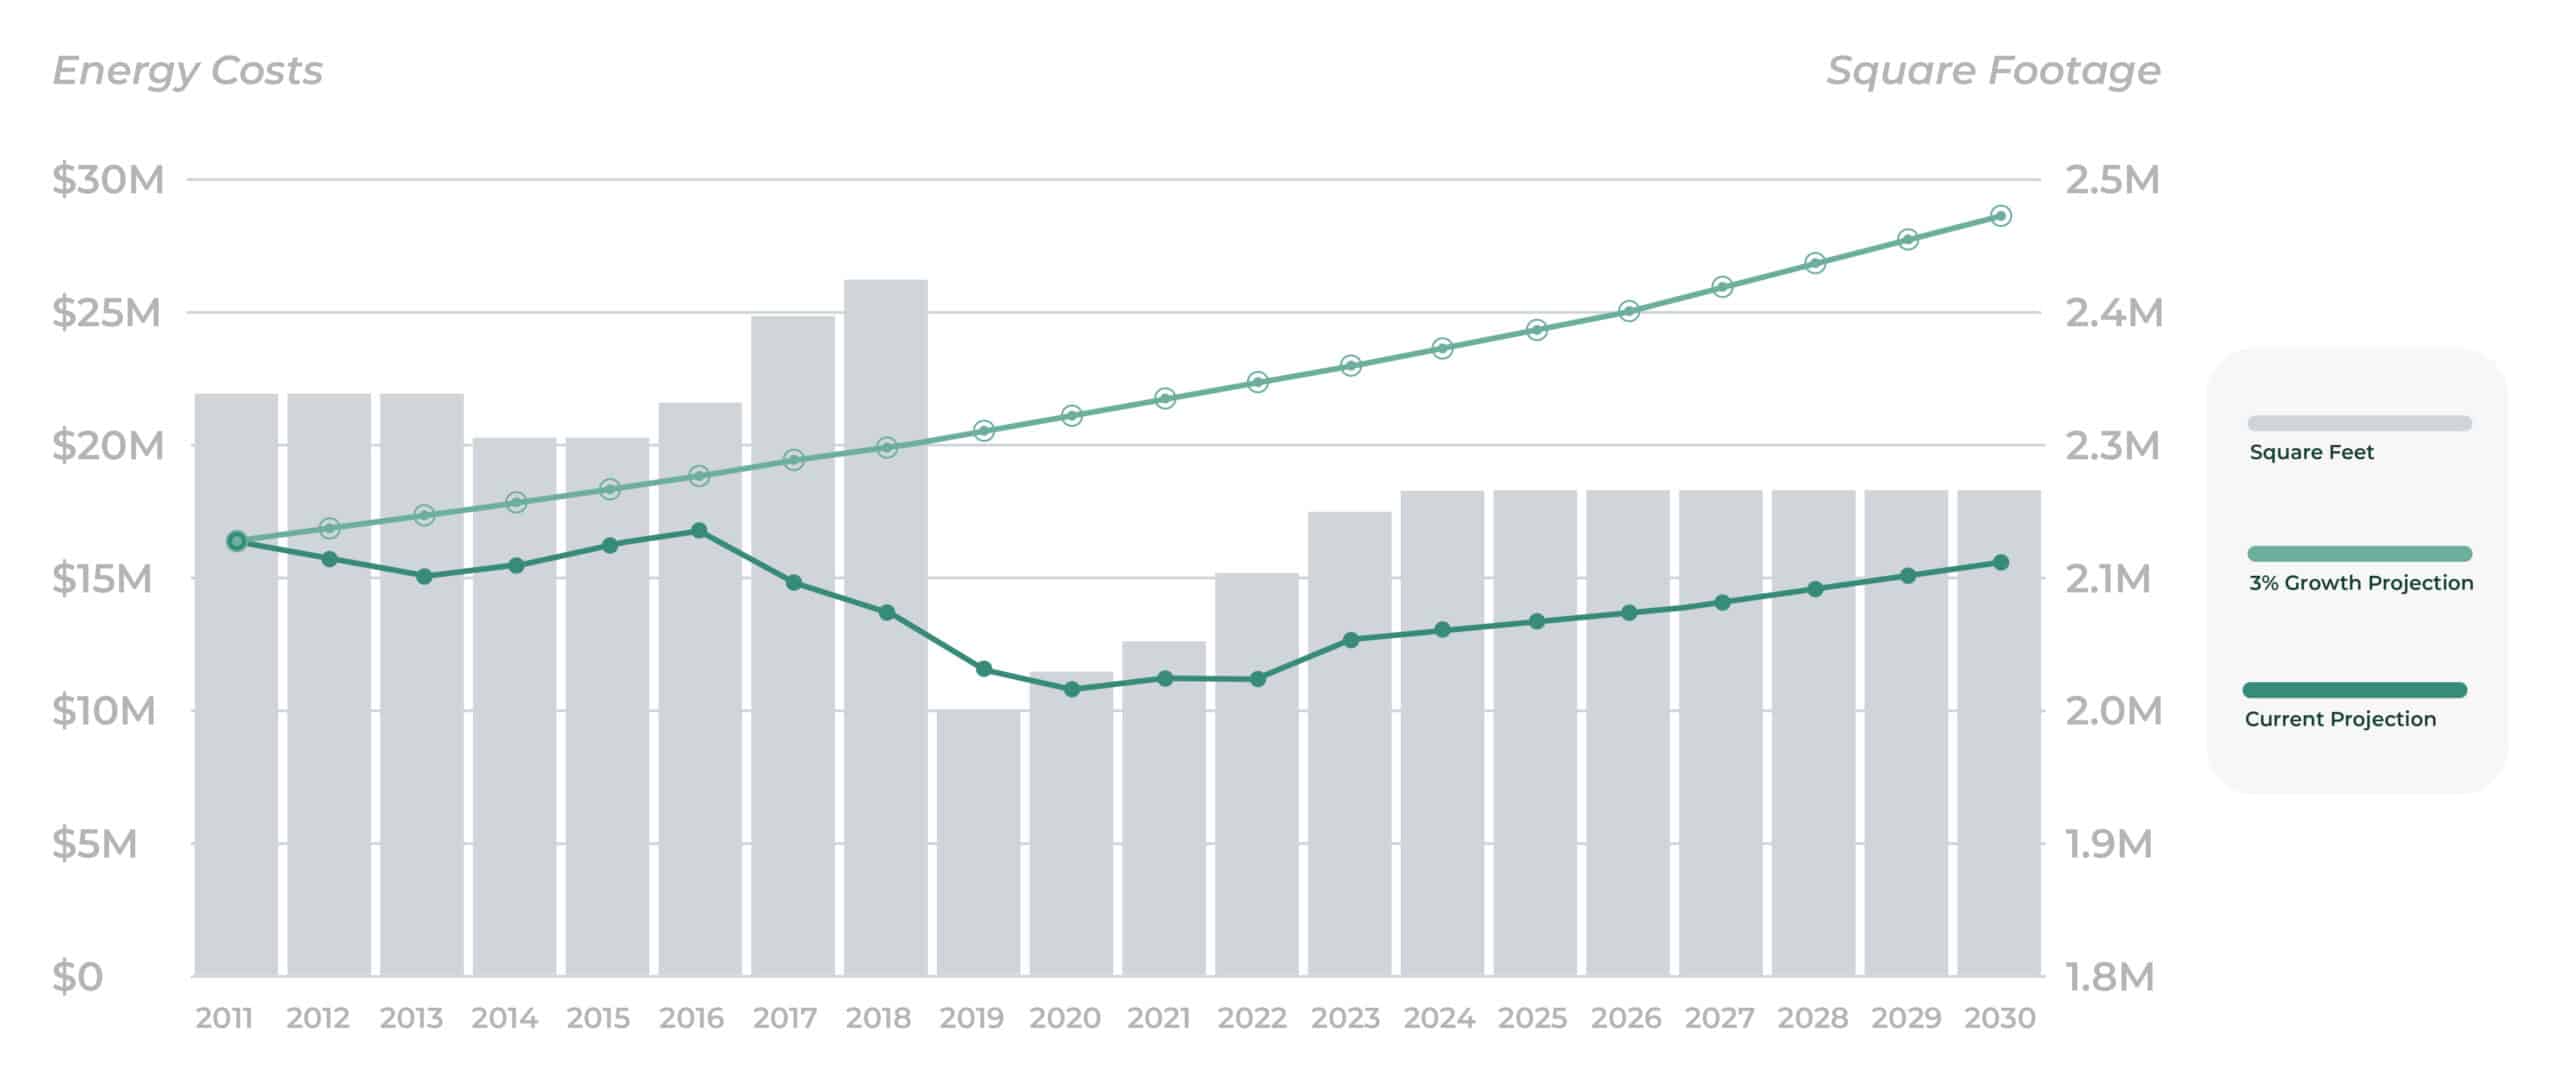
Boston Medical Center’s Energy Costs and Square Footage,
2011–2030
- Totals more than $150 million
- Equivalent to more than $3.0 billion of revenue
2,310,982
Square Feet
2,310,982
Square Feet
2,310,982
Square Feet
2,271,382
Square Feet
2,271,382
Square Feet
2,302,762
Square Feet
2,379,676
Square Feet
2,409,676
Square Feet
2,030,841
Square Feet
2,065,841
Square Feet
2,092,841
Square Feet
2,152,841
Square Feet
2,206,841
Square Feet
2,224,841
Square Feet
2,224,841
Square Feet
2,224,841
Square Feet
2,224,841
Square Feet
2,224,841
Square Feet
2,224,841
Square Feet
2,224,841
Square Feet
$16,240,713
Current Projection
$16,240,713
Current Projection
$15,619,462
Current Projection
$14,924,433
Current Projection
$15,390,586
Current Projection
$16,237,863
Current Projection
$16,627,095
Current Projection
$14,647,017
Current Projection
$13,546,511
Current Projection
$11,385,592
Current Projection
$10,717,814
Current Projection
$11,171,872
Current Projection
$11,033,211
Current Projection
$12,514,827
Current Projection
$12,890,272
Current Projection
$13,276,980
Current Projection
$13,675,289
Current Projection
$14,085,548
Current Projection
$14,508,114
Current Projection
$14,943,358
Current Projection
$15,391,659
Current Projection
$16,240,713
3% Growth Projection
$16,727,934
3% Growth Projection
$17,229,772
3% Growth Projection:
$17,746,665
3% Growth Projection
$18,279,065
3% Growth Projection
$18,827,437
3% Growth Projection
$19,392,260
3% Growth Projection
$19,974,028
3% Growth Projection
$20,573,249
3% Growth Projection
$21,190,446
3% Growth Projection
$21,826,160
3% Growth Projection
$22,480,945
3% Growth Projection
$23,155,373
3% Growth Projection
$23,850,034
3% Growth Projection
$24,565,535
3% Growth Projection
$25,302,501
3% Growth Projection
$26,061,576
3% Growth Projection
$26,843,424
3% Growth Projection
$27,648,726
3% Growth Projection
$28,478,188
3% Growth Projection
Note: BMC projected a 3 percent growth in energy costs in 2019 if it had not reduced its campus’ square footage or implemented any other efficiencies. BMC’s square footage has grown somewhat in recent years, along with energy costs, to accommodate growth in patient volume.
Data: Presentation by Robert Biggio of Boston Medical Center at the Sustainability in Healthcare Hackathon, Massachusetts Institute of Technology, Apr. 21, 2023.
Source: Martha Hostetter and Sarah Klein, Greening the Health Care Safety Net: How Boston Medical Center Reduced Its Carbon Footprint Without Compromising Patient Care (Commonwealth Fund, Aug. 2023). https://doi.org/10.26099/0na0-8v90
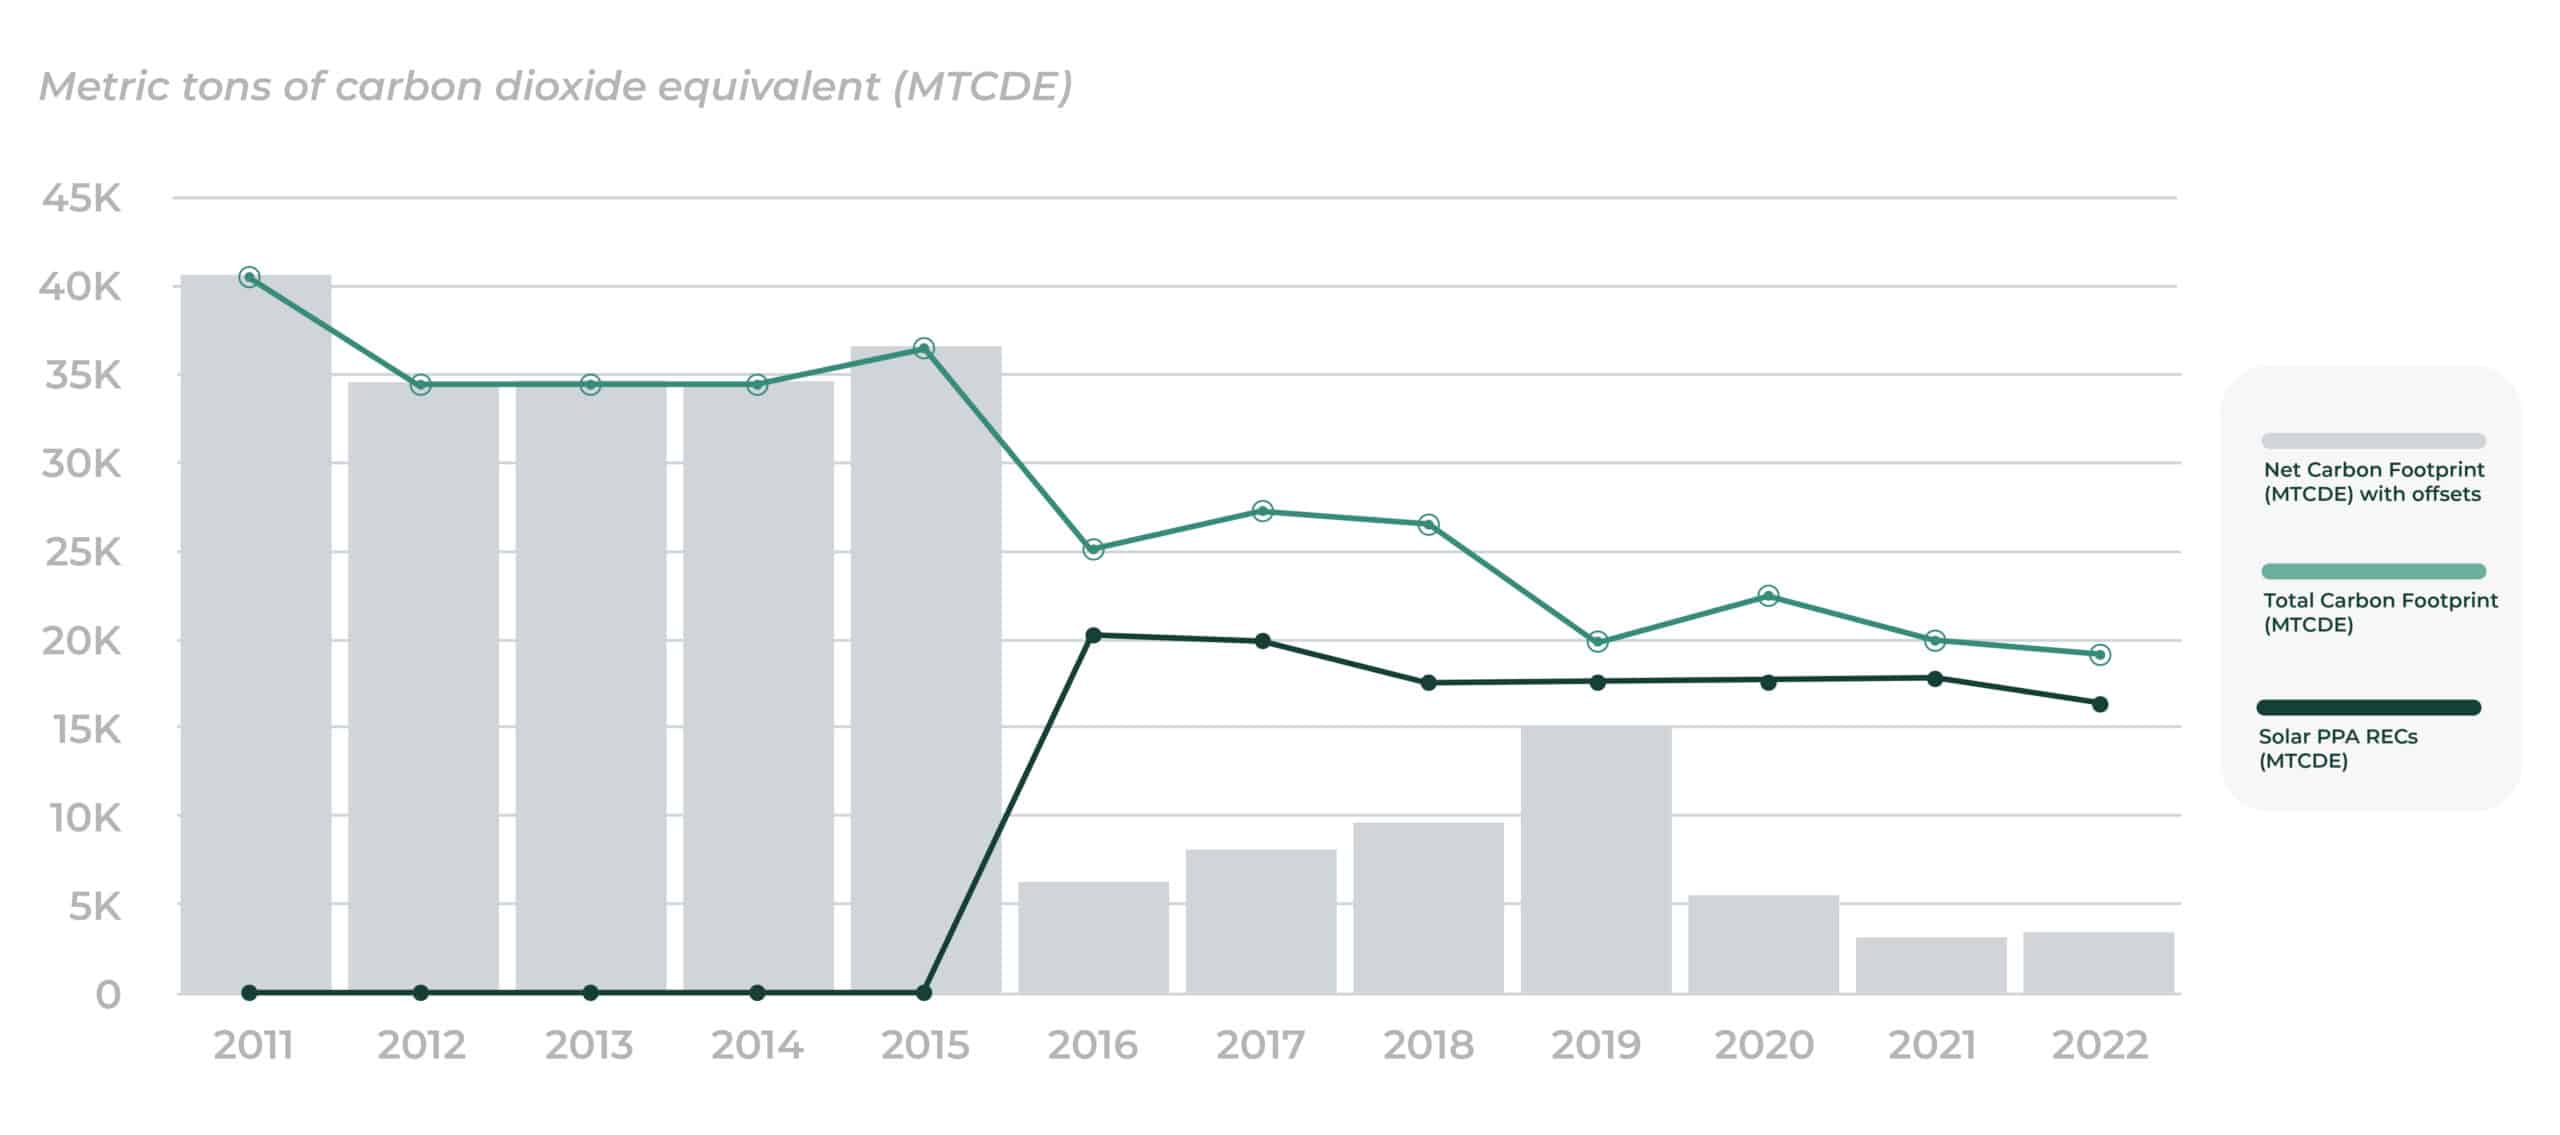
Boston Medical Center’s Carbon Emissions, 2011–2022
Scope 1 and 2
Carbon Emissions
2012-22 Energy efficiency projects
2016 Solar PPA with MIT
2016 Vicinity green steam
40,466
Total Carbon Footprint (MTCDE)
34,400
Total Carbon Footprint (MTCDE)
34,395
Total Carbon Footprint (MTCDE)
34,329
Total Carbon Footprint (MTCDE)
36,493
Total Carbon Footprint (MTCDE)
25,813
Total Carbon Footprint (MTCDE)
27,968
Total Carbon Footprint (MTCDE)
20,560
Total Carbon Footprint (MTCDE)
20,560
Total Carbon Footprint (MTCDE)
23,119
Total Carbon Footprint (MTCDE)
20,747
Total Carbon Footprint (MTCDE)
19,849
Total Carbon Footprint (MTCDE)
0
Solar PPA RECs (MTCDE)
0
Solar PPA RECs (MTCDE)
0
Solar PPA RECs (MTCDE)
0
Solar PPA RECs (MTCDE)
0
Solar PPA RECs (MTCDE)
19,971
Solar PPA RECs (MTCDE)
19,971
Solar PPA RECs (MTCDE)
17,559
Solar PPA RECs (MTCDE)
17,559
Solar PPA RECs (MTCDE)
17,559
Solar PPA RECs (MTCDE)
17,717
Solar PPA RECs (MTCDE)
16,311
Solar PPA RECs (MTCDE)
40,466
Net Carbon Footprint (MTCDE) with offsets
34,400
Net Carbon Footprint (MTCDE) with offsets
34,400
Net Carbon Footprint (MTCDE) with offsets
34,400
Net Carbon Footprint (MTCDE) with offsets
36,493
Net Carbon Footprint (MTCDE) with offsets
5,842
Net Carbon Footprint (MTCDE) with offsets
8,197
Net Carbon Footprint (MTCDE) with offsets
9,647
Net Carbon Footprint (MTCDE) with offsets
3,002
Net Carbon Footprint (MTCDE) with offsets
5,560
Net Carbon Footprint (MTCDE) with offsets
3,030
Net Carbon Footprint (MTCDE) with offsets
3,538
Net Carbon Footprint (MTCDE) with offsets
Note: The reduction in BMC’s carbon emissions in 2016 came from the solar power purchasing agreement (about 66% of the drop), use of green steam (about 20%), and reductions in emissions from electrical use (about 13%). Greenhouse gas emissions are collectively measured as MTCDE.
Data: Presentation by Robert Biggio of Boston Medical Center at the Sustainability in Healthcare Hackathon, Massachusetts Institute of Technology, Apr. 21, 2023.
Source: Martha Hostetter and Sarah Klein, Greening the Health Care Safety Net: How Boston Medical Center Reduced Its Carbon Footprint Without Compromising Patient Care (Commonwealth Fund, Aug. 2023). https://doi.org/10.26099/0na0-8v90
